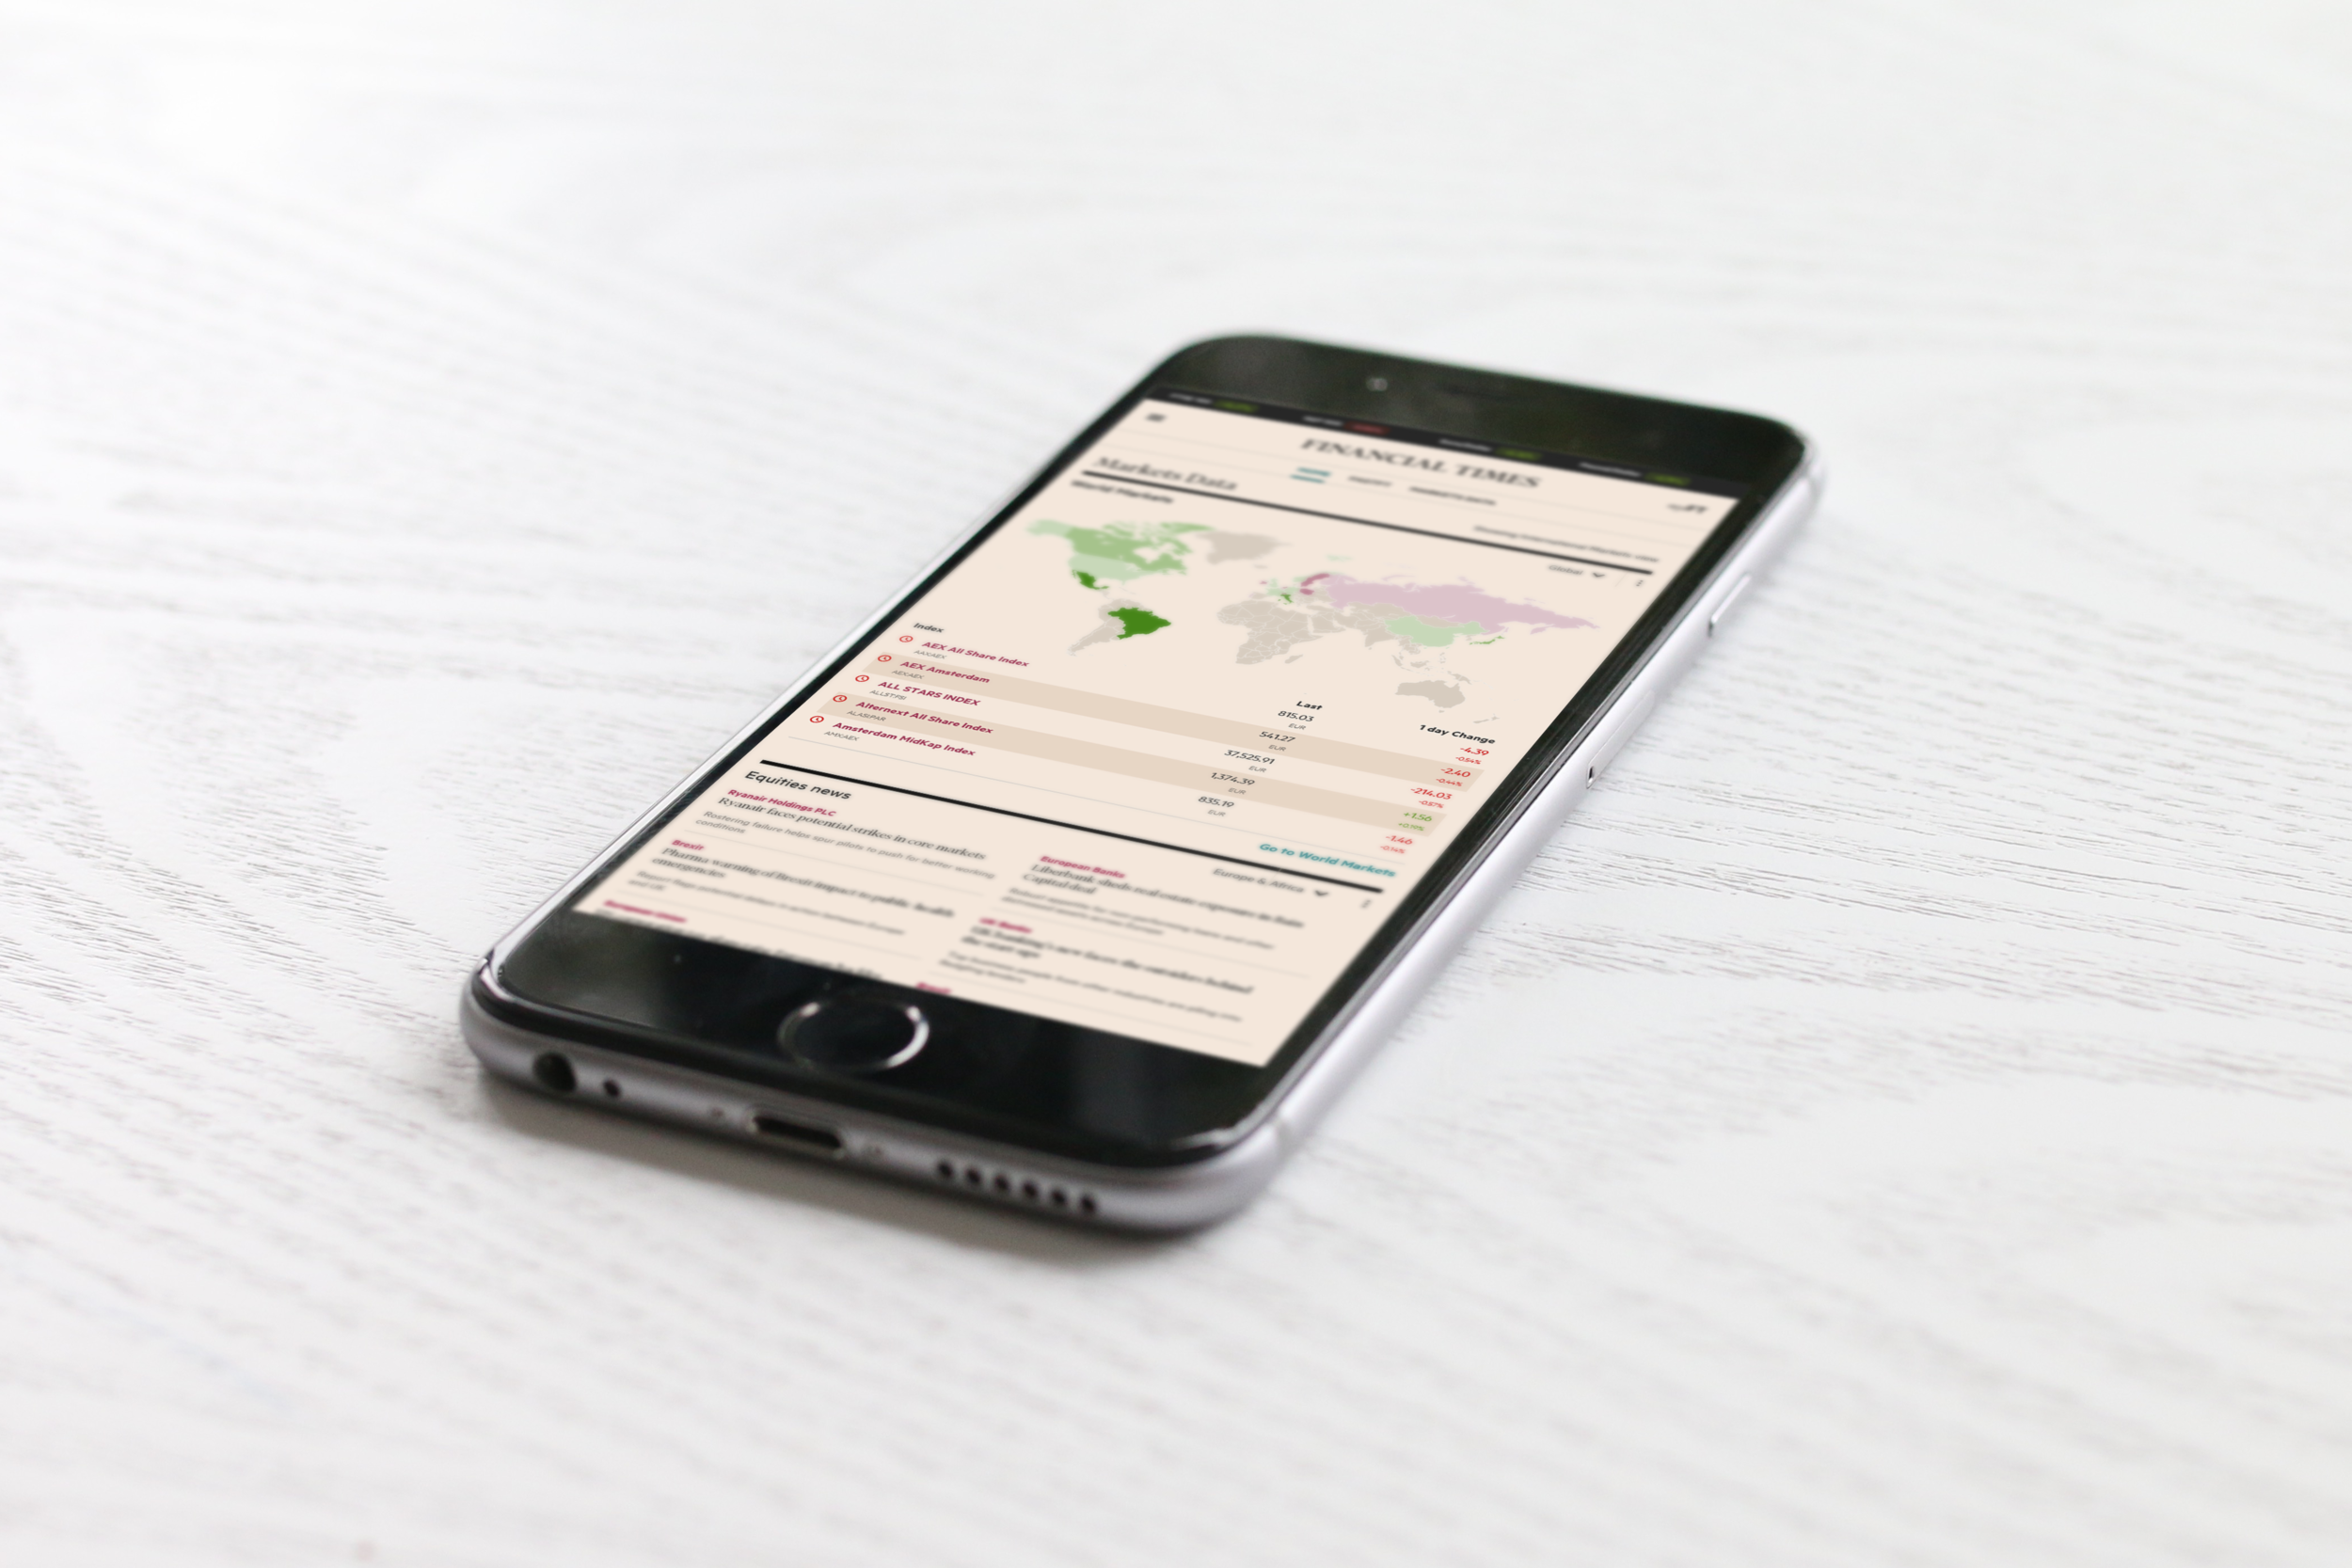
Financial Times Markets Data
Introduction
The Financial Times is one of the world's most influential newspapers in finance and business. Established in London in 1888, the publication now has an average daily readership of 2.2 million.
IHS Markit partners with the Financial Times to present streaming financial information on the site's Markets Data section. Our agency works closely with the FT’s internal UX team to make sure that the markets sections are both consistent with the brand’s overall identity but distinctive from the Financial Times' editorial content.
Please Note:
In order to comply with the terms of a non-disclosure agreement, only content that the client has made public has been included in my portfolio. Research artifacts and sensitive data have been left out in order to comply with the NDA.
My Role
I created wireframes, workflows, interface designs and data visualizations for the Markets Data section. My work has also included researching, proposing, and creating new features. I've worked on this project as a member of a small team and as an individual contributor.
Project Strategy
The Financial Times is known for its reporting and commentary on international news, business and economics. The Markets Data section adds quantitative context to news stories by providing up-to-date information on global stock markets, currency exchange rates, industry data and the performance of a variety of different asset classes.
“The strength of the brand hinges on quality journalism. The Markets Data section exists to provide rich, immersive quantitative context to the FT’s news and editorial content.”

Business Goals
The Financial Times hoped to use the Markets Data section to enrich its respected print journalism. A digital transformation would add value for existing subscribers, empowering existing print customers to use the online offering. These highly interactive online offerings would also appeal to a new and younger demographic of FT readers.

User Goals
Keep track of information on equities, world markets, sectors, industries and companies. Our research revealed that there was already substantial demand for this information, but the FT’s customers often looked to competitors because current offerings did not meet their expectations.
In testing and from gathering data from customer support, we learned that mobile was an area that required design attention.
In order to achieve our strategic goals, the team followed a few key principles:
1. Test throughout the design and development cycle
2. Practice iterative design with an agile team
3. Design visualizations to convey information clearly at all breakpoints
4. Ship frequently and iterate based on learning
Test throughout the design and development cycle
In order to understand what users need to accomplish their goals on the Markets Data site, our team continuously conducted research. We drew insights from site analytics, app analytics, remote unmoderated testing and remote moderated testing.
Practice iterative design with an agile team
The Financial Times' in-house technical team uses agile processes to manage their development cycle. Our agency worked closely with the clients' internal product managers, developers and designers. We adapted our process to fit in seamlessly with the clients' agile processes. Design and development worked together closely and met frequently in order to work harmoniously together.
Design visualizations to convey information clearly at all breakpoints
Our design team has worked to create an informative and data-rich experience that translates to a variety of different platforms. The design team prioritized the most useful presentation of data over the most aesthetically pleasing presentation. The site had to perform quickly on desktop, tablet and mobile browsers without losing any of the information that is valuable to the The Financial Times' customer base.
Ship frequently and iterate based on learning
Our team shipped updates frequently, we strive to be cognizant of users' needs for consistency. We test new designs frequently to ensure that our work does not disrupt the research processes that FT readers have established.
Visual Design
Interface design plays a subtle yet important role in media sites. The product must have a distinctive look that does not distract users’ attention from the main news, editorial or video content. One of our design team's primary goals was to create a distinctive cross-platform experience that keeps content in the spotlight. We challenged ourselves to create a visual style that clearly distinguished our site from competing media brands but was subtle enough to ensure that a reader's focus was on the site's content rather than its design.
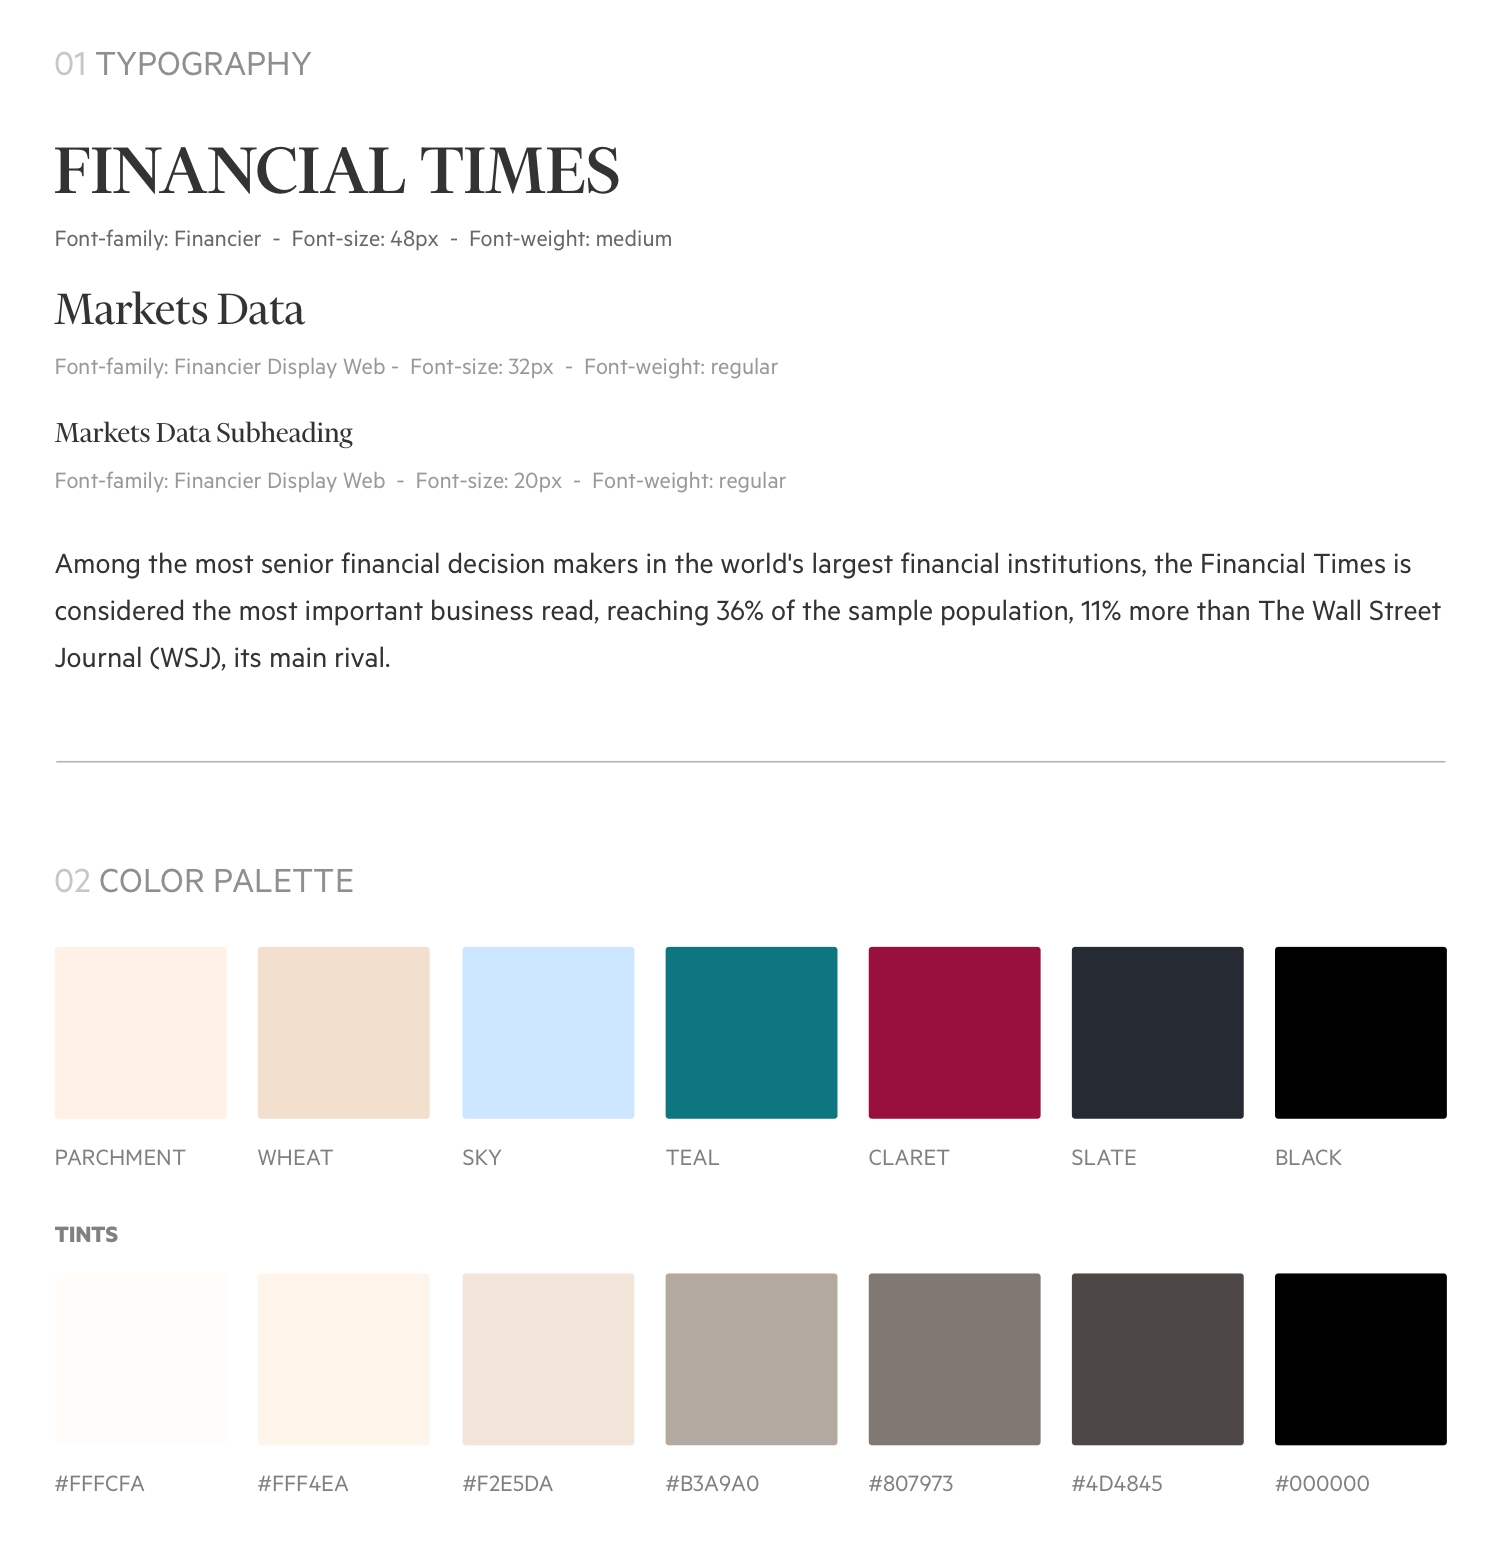
Building on the Brand
The Financial Times is an established and respected brand. The homepage embraces modern aesthetics but still visually recalls the salmon-colored broadsheets from the paper's early days of publication. The site's main pages are designed to draw the reader’s attention to the Financial Times’ news and editorial content. In the Markets Data section, our design team has to design with the needs of quantitative content in mind. The pages that we build need to incorporate long lines of numerical data, customized tables and highly interactive charts.
Improving Interactivity and Adding Value
Once our team crafted a coherent, useful and usable experience across multiple devices we tested to ensure that user goals were being met. In order to further improve a product that was deemed highly successful by our client stakeholders, our team began exploring how to make the Markets Data section more helpful to FT subscribers.
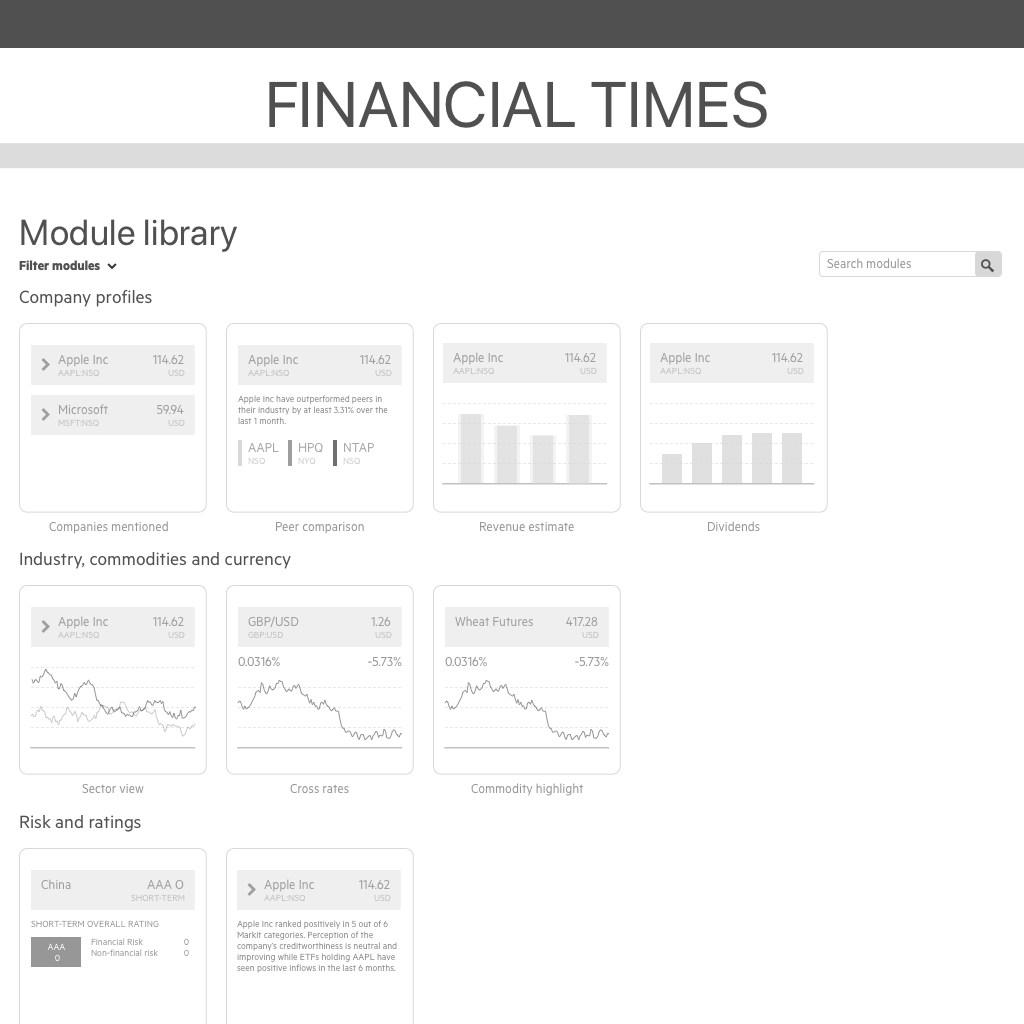
We created a module system that was personalized based on subscriber data that we already had such as the users’ location, company, role, and sector. Subscribers could also choose to customize their experiences by adding companies from their watchlist, competitors, industries of interest, and more.
Onboarding for the new Markets Data section
I created an onboarding guide to the new features to ease the transition from the old Markets Data section to the new one. This onboarding section is still live today to help new subscribers as well as primarily print subscribers get the most out of this part of the website.
Results
User engagement has increased substantially. Usage of the mobile version of the site has grown and feedback has been very positive to date. On average, users spend more time on the Markets Data section and discover content more easily. This project is still ongoing and I anticipate that our key metrics will improve further still as designs evolve.